You clicked on this one pretty fast, didn’t you? This is a perfect example of ‘clickbait,’ and it’s a good example of how nefarious actors trying to sell you stuff might cause you to take action with your investments that might hurt you in the long run. It could also have been the opposite, something like “Don’t Miss Out On A Once In A Generation Investment : [Fill in the blank: Bitcoin, A.I., Gold, Quantum Computing, TikTok Marketing]”. As such, I’d like to talk about how biases could hurt your chances of financial success.
If you spend any time on the internet doing what you believe is research, you likely will have been inundated with articles of the same ilk. Unfortunately, many of the articles you read will come from sources with conflicts of interest. They are incentivized, often for money, likes, and clicks, and most likely to incite fear or greed in an effort to make you second-guess your current strategies. In the end, they are often trying to prey on your emotions to sell something. The key is finding impartial, unbiased sources that look to academics for long-term investment solutions.
Behavioral science is an important area of study in finance. Behavioral factors and our emotional state play a very significant role in wealth building and wealth preservation. These factors often become more significant as we age and during personal, political, social, or market turmoil, which, of course, are all constant factors that appear during the course of our lives.
I think we all understand that people have biases, but we often, to our own detriment, rationalize that our own biases are well-managed and our decisions are sound. I would posit that one of my most important duties as a financial advisor at WorthPointe is to manage and strengthen rational decision-making and guide you through times that might otherwise tempt you to make decisions today that would hurt you in the long run. This is done, amongst other ways, by knowing you as a person and investor, intimate knowledge of investment structures and historical market cycles, as well as years of experience.
We, as advisors, know that biases are potentially in play when we hear the following statement from an investor. “I want to [sell/buy] this [security/sector] because of [some reason]. Call it a trigger for us to roll up our sleeves and ramp up the education process. In truth, there may be valid reasons for the sentiment, and we are here to listen and discuss these things with our clients; however, from my experience, it’s often driven by personal biases, often created by headline news, or even valid intellectual curiosity that might make you question or validate your financial path forward.
Here’s a short paper worth reading by Russell Investments that summarizes some of the issues I’m discussing: “How To Avoid Common Behavioral Biases”.
One of the biases identified in the paper is stated as follows:
“Home Bias & Country Specific Risk Humans tend to prefer what is familiar or well-known. One of the common results of this in portfolios around the world is the home country bias: the tendency to allocate a greater portion of one’s portfolio to assets domiciled in your home country. The home country bias limits the amount of diversification in investor portfolios and exposes investors to significant country-specific risk. “
Overcoming this bias really sets the starting point for our investment philosophy and how we build portfolios for long-term opportunities for success and resiliency.
As a basis for resilient portfolio construction, we start by looking at the market capitalization(cap) of countries around the world. Think of market cap as adding up the value of all listed stocks in a country; this gets you the country’s total market cap. Here’s a good visual of the market caps of countries from around the world.
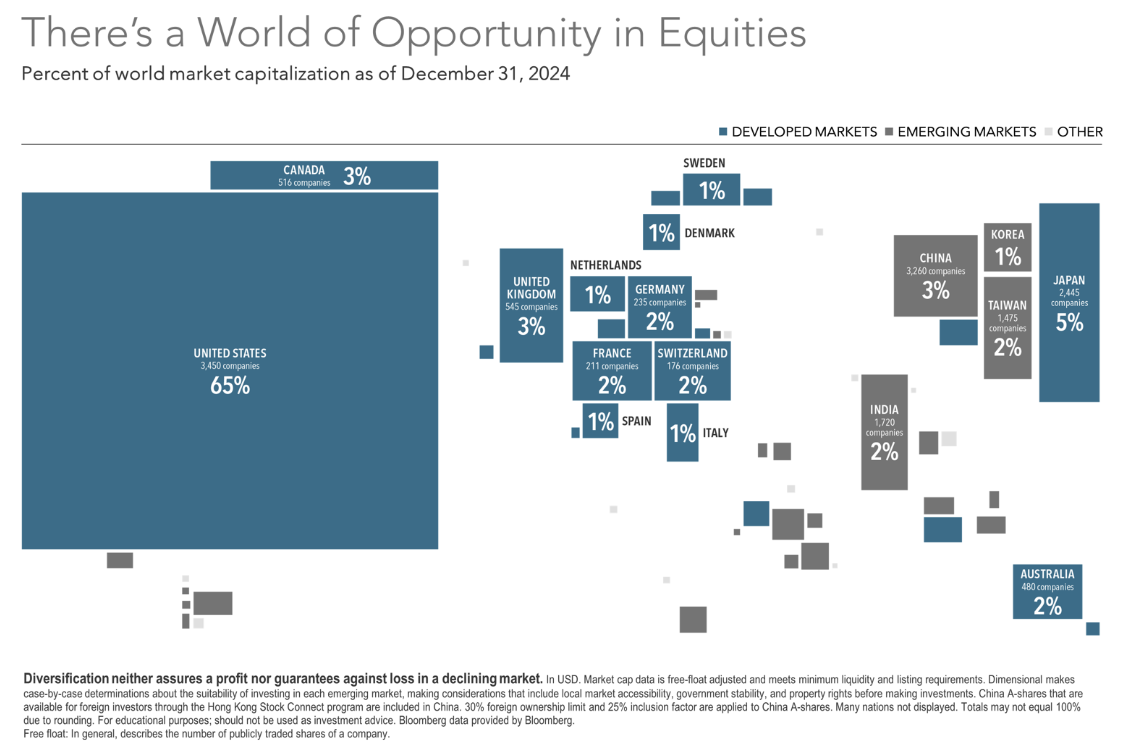
Many investors are 100% or mostly invested in U.S. securities, but as can be seen from the chart above, the U.S. “only” represented 65% of the global market cap as of 12/31/2024. Drilling further down into each country, you will have market weights to large companies, small companies, profitable companies, sectors, etc., so the analysis gets more complex than just country market cap. However, for a global allocation at the country level, having about 65% of your equity exposure in the U.S., and the rest proportionally invested in international and emerging markets, is a good place to start for most investors. There are many reasons to do this beyond the scope of this report, but the point is that we are facilitating strategies that help immunize against biases both today and into the future.
In summary, you want to build a portfolio resilient to future events from the start, rather than letting headlines drive any changes. That’s not to say that changes in investment strategy should not be made based on changes to your personal situation or investment due diligence. Excellent portfolio construction from the start helps breed confidence and peace of mind through headline and real-life volatility prior to the events occurring, and if done within the framework of a good financial plan, can help satisfy a higher probability of success.
Market Review: 2025 Q3
KEY TAKEAWAYS
- The broad market S&P 500 and tech-heavy Nasdaq both hit record highs in September. (Source: Morningstar)
- The Fed lowered interest rates by a quarter point, for the first time since December 2024. (Source: federalreserve.gov)
- Small-cap stocks outpaced large caps in the US and globally, but value lagged growth.
Stocks extended gains in the third quarter, with major indices in the US hitting new records, including the S&P 500 and Nasdaq, as trade negotiations proceeded and the US Federal Reserve cut interest rates.1 The rate reduction in September was the first in nearly a year. Stocks’ rise was a continuation of the gains that had preceded for much of 2025, aside from the market’s sharp fall and quick recovery during a volatile April. Developed international equities lagged the US in the third quarter, but emerging markets were higher, and both remained ahead of the US for the year. In the bond market, US Treasuries were slightly higher, with the benchmark 10-year yield just above 4%.2
The Fed cut the federal funds rate by 25 basis points to a range between 4%–4.25% in September, the first move lower since December.3 In August, the US core consumer price index, which excludes more-volatile food and energy items, was shown rising 3.1% from a year ago.4 That’s above the Fed’s target rate of 2%. The Fed’s September rate cut came with officials referencing their two goals of keeping inflation and unemployment in check but noting that “downside risks to employment have risen.”
Trade negotiations between the United States and other countries continued during the quarter, with the US administration reaching a number of trade deals, including with the European Union, the United Kingdom, and Japan. But questions remained about levies that may be imposed on goods from China, India, Mexico, and elsewhere.5 In the coming months, the US Supreme Court is also set to weigh in on a case to determine the validity of global tariffs that have been imposed by the current administration.6
Against this backdrop, US stocks advanced, with the S&P 500 Index rising 7.7% and the tech-heavy Nasdaq adding 11.3% as of September 19. Shares of NVIDIA stood out as the firm became the first public company to reach a market capitalization of $4 trillion, making it nearly 8% of the S&P 500 Index.7 Global equities, as measured by the MSCI All Country World Index, rose 7.2% as of September 19, trailing the US. Developed international stocks outside the US added 4.8%, as measured by the MSCI World ex USA Index. The MSCI Emerging Markets Index gained 10.2%.8
Small-cap stocks beat large caps in the US and globally through September 19, with US small caps having some of their best returns in recent years.9 Value stocks, or those with low relative prices, did not rise as much as growth stocks in the US and globally. High profitability stocks were outpaced by low profitability stocks in global developed markets as of September 19, while the opposite was true in emerging markets, with high profitability stocks beating their low profitability counterparts.10
In the bond market, US Treasuries were 1.5% higher, sending the yield on the benchmark 10-year Treasury down to 4.14%.11 The broader bond market also gained, with the Bloomberg US Aggregate Bond Index up 2.1% and the Bloomberg Global Aggregate Bond Index (hedged to USD)—a broad benchmark of sovereign and corporate debt—adding 1.2% as of September 19.12
Footnotes
- S&P data © 2025 S&P Dow Jones Indices LLC, a division of S&P Global. The S&P is a market capitalization-weighted index of 500 widely held stocks often used as a proxy for the stock market. Standard & Poor’s chooses the member companies for the S&P based on market size, liquidity, and industry group representation. Included are the common stocks of industrial, financial, utility, and transportation companies. All rights reserved. Data as of September 19, 2025. Indices are not available for direct investment. Connor Smith, “Stocks Hit New Records in a Rate Cut Rally,” Barron’s, September 18, 2025.
- Returns are based on the Bloomberg US Treasury Bond Index as of September 19, 2025. This is a family of indices that measure the performance of different segments of the U.S. Treasury market, including the total U.S. Treasury market (excluding bills) and specific maturity ranges like the 1-3 Year and 7-10 Year segments. These indices track US dollar-denominated, fixed-rate, nominal debt issued by the U.S. Treasury and are widely used as benchmarks for fixed-income investments and financial products like ETFs. Bloomberg data is provided by Bloomberg Finance LP. Source for US Treasuries: US Department of the Treasury.
- The federal-funds rate is the overnight interest rate at which one depository institution (like a bank) lends to another institution some of its funds that are held at the Federal Reserve. Source: “Federal Reserve Issues FOMC Statement,” US Federal Reserve, September 17, 2025; Colby Smith, “Fed Cuts Rates for First Time this Year,” The New York Times, September 17, 2025.
- Inflation data is as defined by the consumer price index from the US Bureau of Labor Statistics; the core CPI is an aggregate of prices paid by urban consumers for a typical basket of goods, excluding food and energy; Colby Smith, “Rise in US Inflation Is Likely to Keep Fed Cautious on Pace of Rate Cuts,” The New York Times, September 11, 2025; Colby Smith, “Fed Cuts Rates for First Time this Year,” The New York Times, September 17, 2025.
- Chao Deng and Drew An-Pham, “Trump’s Tariffs: Where He Started, What He Threatened, Where He Ended Up,” The Wall Street Journal, August 27, 2025.
- Louise Radnofsky, “Supreme Court Agrees to Fast-Track Trump’s Tariff Appeal,” The Wall Street Journal, September 9, 2025.
- Jeff Sommer, “How Long Can This Uncanny Stock Market Prosper?” The New York Times, August 22, 2025. This information should not be considered a recommendation to buy or sell a particular security. Named securities may be held in accounts managed by Dimensional. It should not be assumed that an investment in the securities identified was or would be profitable.
- MSCI data © MSCI 2025, all rights reserved. Data as of September 19, 2025. Indices are not available for direct investment.
- Jacob Sonenshine, “Small-Cap Stocks Are on a Roll. What Could Push Them Higher.” Barron’s, September 10, 2025
- The MSCI All Country World Value Index rose 5.6%, while the MSCI All Country World Growth Index rose 8.7% as of September 19, 2025; the MSCI All Country World Small Cap Index advanced 8.5%, while the larger-cap MSCI All Country World Index rose 7.2% as of September 19, 2025; the Russell 2000 Index of US small cap stocks returned 12.9% through September 19, 2025; Frank Russell Company is the source and owner of the trademarks, service marks, and copyrights related to the Russell Indexes; the Fama/French Developed High Profitability Index rose 7.4% versus 9.1% for its low profitability counterpart as of September 19, 2025; the Fama/French Emerging Markets High Profitability Index rose 11.8%, and its low profitability counterpart rose 8.7% as of September 19, 2025. See “Index Descriptions” for descriptions of the Fama/French index data. Past performance is no guarantee of future results. Actual returns may be lower. The Fama/French indices represent academic concepts that may be used in portfolio construction and are not available for direct investment or for use as a benchmark. Index returns are not representative of actual portfolios and do not reflect costs and fees associated with an actual investment.
- “Daily Treasury Par Yield Curve Rates,” US Department of the Treasury. Data as of September 19, 2025.
- Bloomberg data provided by Bloomberg Finance LP.
Morgan H Smith Jr. is an investment advisor with Constitution Wealth. Constitution Wealth is a registered investment adviser in Wyoming. Constitution Wealth is registered with the Securities and Exchange Commission (SEC). Registration of an investment advisor does not imply any specific level of skill or training and does not constitute an endorsement of the firm by the commission. Constitution Wealth only transacts business in states in which the firm is properly registered or is excluded or exempted from registration. A copy of Constitution Wealth’s current written disclosure brochure filed with the SEC, which discusses among other things, Constitution Wealth’s business practices, services, and fees, is available through the SEC’s website at www.adviserinfo.sec.gov.
Please note, the information provided in this document is for informational purposes only and investors should determine for themselves whether a particular service or product is suitable for their investment needs. Please refer to the disclosure and offering documents for further information concerning specific products or services.
Any hypothetical, backtested performance has been provided for illustrative purposes only, and is not necessarily, and does not purport to be, indicative, or a guarantee, of future results or the adviser’s skill. Hypothetical, backtested performance does not represent actual performance. The results are prepared by retroactive application of a model, with the benefit of hindsight, and actual results may vary substantially. The preparation of such information is based on underlying assumptions, and does not represent the actual performance of any fund, portfolio, or investor, it is subject to risk and limitations that are not applicable to non-hypothetical performance presentations. Although advisor believes any hypothetical, backtested performance calculations described herein are based on reasonable assumptions, the use of different assumptions would produce different results. For the foregoing and other similar reasons, the comparability of hypothetical, backtested performance to the prior (or future) actual performance of a fund is limited, and prospective investors should not unduly rely on any such information in making an investment decision.
Nothing provided in this document constitutes tax advice. Individuals should seek the advice of their own tax advisor for specific information regarding tax consequences of investments. Investments in securities entail risk and are not suitable for all investors. This site is not a recommendation or an offer to sell (or solicitation of an offer to buy) securities in the U.S. or in any other jurisdiction.
This document may contain forward-looking statements relating to the objectives, opportunities, and the future performance of the U.S. market generally. Forward-looking statements may be identified by the use of such words as “believe,” “expect,” “anticipate,” “should,” “planned,” “estimated,” “potential,” and other similar terms. Examples of forward-looking statements include, but are not limited to, estimates with respect to financial condition, results of operations, and success or lack of success of any particular investment strategy. All are subject to various factors, including, but not limited to general and local economic conditions; changing levels of competition within certain industries and markets; changes in interest rates; changes in legislation or regulation; and other economic, competitive, governmental, regulatory, and technological factors affecting a portfolio’s operations that could cause actual results to differ materially from projected results. Such statements are forward-looking in nature and involve a number of known and unknown risks, uncertainties, and other factors, and accordingly, actual results may differ materially from those reflected or contemplated in such forward-looking statements. Prospective investors are cautioned not to place undue reliance on any forward-looking statements or examples. None of Constitution Wealth or any of its affiliates or principals or any other individual or entity assumes any obligation to update any forward-looking statements as a result of new information, subsequent events, or any other circumstances. All statements made herein speak only as of the date they were made.
Any indices and other financial benchmarks shown are provided for illustrative purposes only, are unmanaged, reflect reinvestment of income and dividends, and do not reflect the impact of advisory fees. Investors cannot invest directly in an index. Comparisons to indexes have limitations because indexes have volatility and other material characteristics that may differ from a particular hedge fund.